| ||||||||||||||||||||||||||||
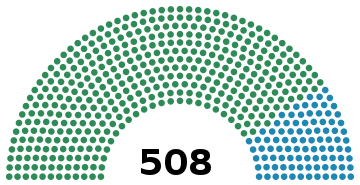
All 508 seats in the Chamber of Deputies 255 seats needed for a majority | ||||||||||||||||||||||||||||
|---|---|---|---|---|---|---|---|---|---|---|---|---|---|---|---|---|---|---|---|---|---|---|---|---|---|---|---|---|
| ||||||||||||||||||||||||||||
 Results by electoral college Results by electoral college | ||||||||||||||||||||||||||||
| ||||||||||||||||||||||||||||
General elections were held in Italy on 5 November, with a second round of voting on 12 November.
Campaign
The Historical Left was led by the current Prime Minister of Italy, Agostino Depretis, who became head of the government and early elections were called.
On the other hand, the bloc of the Historical Right was led by Marco Minghetti, former prime minister from Bologna.
The election on 5 and 12 November was a snap one, and it came after MPs from Tuscany became dissatisfied with the government of Minghetti following its refusal to intervene in the financial problems of Florence. The government was defeated on a vote on nationalising railways on 18 March 1876 and was forced to resign and Depretis was appointed prime minister. For the first time, the left-wing won an election, taking 414 of the 508 seats, of which 12 were extreme left-wingers. As opposed to the previous right-wing governments, whose members were largely aristocrats representing rentiers from the north of the country, and held moderate political views including loyalty to the crown and low government spending, the left-wing government represented the bourgeoisie of the south of the country and supported low taxation, secularism, a strong foreign policy and public jobs.
Only 605,007 men of a total population of around 28 million were entitled to vote.
Parties and leaders
| Party | Ideology | Leader | |
|---|---|---|---|
| Historical Left | Liberalism | Agostino Depretis | |
| Historical Right | Conservatism | Marco Minghetti | |
Results
 | |||||
|---|---|---|---|---|---|
| Party | Votes | % | Seats | +/– | |
| Historical Left | 243,319 | 70.21 | 414 | +182 | |
| Historical Right | 97,726 | 28.20 | 94 | −182 | |
| Others | 5,530 | 1.60 | 0 | – | |
| Total | 346,575 | 100.00 | 508 | 0 | |
| Valid votes | 346,575 | 96.74 | |||
| Invalid/blank votes | 11,688 | 3.26 | |||
| Total votes | 358,263 | 100.00 | |||
| Registered voters/turnout | 605,007 | 59.22 | |||
| Source: National Institute of Statistics | |||||
References
- Dieter Nohlen & Philip Stöver (2010) Elections in Europe: A data handbook, p1047 ISBN 978-3-8329-5609-7
- ^ Nohlen & Stöver, p1029
- Nohlen & Stöver, p1028
- Nohlen & Stöver, p1049

