| |||||||||||||||||
| |||||||||||||||||
 County results County results Adams: 40–50% 50–60% 60–70% Meyer: 40–50% 50–60% 70–80% | |||||||||||||||||
| |||||||||||||||||
| Elections in Colorado | ||||
|---|---|---|---|---|
 | ||||
| Federal government | ||||
| State government | ||||
Ballot measures
|
||||
Colorado Springs
|
||||
Denver
|
||||
El Paso County
|
||||
Pueblo
|
||||
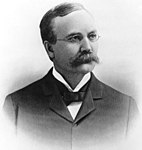
The 1886 Colorado gubernatorial election was held on November 2, 1886. Democratic nominee Alva Adams defeated Republican nominee William H. Meyer with 49.66% of the vote.
General election
Candidates
Major party candidates
- Alva Adams, Democratic
- William H. Meyer, Republican
Other candidates
- William H. Fishback, Prohibition
Results
| Party | Candidate | Votes | % | ±% | |
|---|---|---|---|---|---|
| Democratic | Alva Adams | 29,234 | 49.66% | +3.57% | |
| Republican | William H. Meyer | 26,816 | 45.55% | −5.19% | |
| Prohibition | William H. Fishback | 2,710 | 4.60% | N/A | |
| Majority | 2,418 | 4.11% | |||
| Turnout | 58,760 | ||||
| Democratic gain from Republican | Swing | ||||
By county
| County | Adams % | Adams # | Meyer % | Meyer # | Fishback % | Fishback # | Total |
|---|---|---|---|---|---|---|---|
| Arapahoe | 46.63% | 5,132 | 48.48% | 5,335 | 4.88% | 537 | 11,004 |
| Archuleta | 49.65% | 72 | 50.34% | 73 | 0.00% | 0 | 145 |
| Bent | 67.53% | 568 | 32.46% | 273 | 0.00% | 0 | 841 |
| Boulder | 53.48% | 1,220 | 30.86% | 704 | 15.65% | 357 | 2,281 |
| Chaffee | 49.91% | 924 | 48.83% | 904 | 1.23% | 23 | 1,851 |
| Clear Creek | 40.54% | 740 | 52.98% | 967 | 6.46% | 118 | 1,825 |
| Conejos | 61.09% | 713 | 38.81% | 453 | 0.08% | 1 | 1,167 |
| Costilla | 27.91% | 194 | 72.08% | 501 | 0.00% | 0 | 695 |
| Custer | 37.85% | 391 | 52.56% | 543 | 9.58% | 99 | 1,033 |
| Delta | 59.07% | 231 | 40.40% | 158 | 0.51% | 2 | 391 |
| Dolores | 43.65% | 86 | 56.34% | 111 | 0.00% | 0 | 197 |
| Douglas | 47.50% | 219 | 50.97% | 235 | 1.51% | 7 | 461 |
| Eagle | 48.57% | 359 | 50.87% | 376 | 0.54% | 4 | 739 |
| El Paso | 40.30% | 611 | 49.14% | 745 | 10.55% | 160 | 1,516 |
| Elbert | 47.51% | 210 | 49.09% | 217 | 3.39% | 15 | 442 |
| Fremont | 40.78% | 657 | 51.14% | 824 | 8.06% | 130 | 1,611 |
| Garfield | 48.91% | 452 | 49.35% | 456 | 1.73% | 16 | 924 |
| Gilpin | 36.14% | 570 | 57.57% | 908 | 6.27% | 99 | 1,577 |
| Grand | 39.01% | 71 | 59.89% | 109 | 1.09% | 2 | 182 |
| Gunnison | 48.31% | 790 | 47.82% | 782 | 3.85% | 63 | 1,635 |
| Hinsdale | 48.94% | 116 | 50.21% | 119 | 0.84% | 2 | 237 |
| Huerfano | 49.43% | 523 | 49.81% | 527 | 0.75% | 8 | 1,058 |
| Jefferson | 46.34% | 646 | 43.54% | 607 | 10.11% | 141 | 1,394 |
| La Plata | 50.61% | 578 | 48.42% | 553 | 0.96% | 11 | 1,142 |
| Lake | 55.49% | 2,749 | 43.82% | 2,171 | 0.68% | 34 | 4,954 |
| Larimer | 42.83% | 723 | 37.79% | 638 | 19.37% | 327 | 1,688 |
| Las Animas | 65.76% | 1,500 | 33.88% | 773 | 0.35% | 8 | 2,281 |
| Mesa | 44.12% | 274 | 54.42% | 338 | 1.44% | 9 | 621 |
| Montrose | 48.51% | 326 | 48.51% | 326 | 2.97% | 20 | 672 |
| Ouray | 61.31% | 702 | 38.34% | 439 | 0.34% | 4 | 1,145 |
| Park | 48.02% | 474 | 51.57% | 509 | 0.40% | 4 | 987 |
| Pitkin | 49.17% | 776 | 49.87% | 787 | 0.95% | 15 | 1,578 |
| Pueblo | 59.11% | 1,579 | 37.85% | 1,011 | 3.03% | 81 | 2,671 |
| Rio Grande | 44.26% | 270 | 53.27% | 325 | 2.45% | 15 | 610 |
| Routt | 48.54% | 133 | 51.45% | 141 | 0.00% | 0 | 274 |
| Saguache | 52.62% | 361 | 46.20% | 317 | 1.16% | 8 | 686 |
| San Juan | 47.58% | 414 | 52.18% | 454 | 0.22% | 2 | 870 |
| San Miguel | 55.29% | 470 | 44.70% | 380 | 0.00% | 0 | 850 |
| Summit | 50.25% | 492 | 49.54% | 485 | 0.20% | 2 | 979 |
| Weld | 44.78% | 1,318 | 42.20% | 1,242 | 13.01% | 383 | 2,943 |
References
- Guide to U.S. elections. CQ Press. 2005. ISBN 9781568029818. Retrieved June 19, 2020.
| Presidential elections | |||||
|---|---|---|---|---|---|
| Senate elections |
| ||||
| House elections | |||||
| State elections | |||||
| Gubernatorial elections | |||||
| Legislative elections |
| ||||

