Main article: 1988 United States presidential election
The 1988 United States presidential election in South Dakota took place on November 8, 1988. All 50 states and the District of Columbia , were part of the 1988 United States presidential election . Voters chose three electors to the Electoral College , which selected the president and vice president .
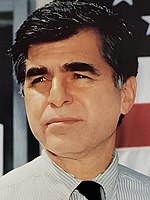
South Dakota was won by incumbent United States Vice President George H. W. Bush of Texas , who was running against Massachusetts Governor Michael Dukakis . Bush ran with Indiana Senator Dan Quayle as Vice President, and Dukakis ran with Texas Senator Lloyd Bentsen .
South Dakota weighed in for this election as 1.5% more Democratic than the national average. This is the last of only four elections since statehood when South Dakota has voted more Democratic than the national average, an anomaly probably caused by the persistent crisis in the United States' farming sector during the decade .
Bush won the election in South Dakota with a 6-point margin; he became the first Republican to win the White House without winning Corson County since it was established in 1909.
The presidential election of 1988 was a very partisan election for South Dakota, with more than 99 percent of the electorate voting for either the Republican or the Democratic parties, and only five candidates appearing on the ballot. While most counties turned out in this election for Bush, the highly populated centers of Brown County and Sioux Falls 's Minnehaha County , voted in majority for Dukakis.
Results
Results by county
County
George H.W. Bush
Michael Dukakis
Ron Paul
Lenora Fulani
James Warren
Margin
Total votes cast
#
%
#
%
#
%
#
%
#
%
#
%
Aurora
856
46.17%
987
53.24%
5
0.27%
5
0.27%
1
0.05%
-131
-7.07%
1,854
Beadle
4,611
50.23%
4,523
49.27%
29
0.32%
15
0.16%
2
0.02%
88
0.96%
9,180
Bennett
663
52.54%
579
45.88%
18
1.43%
1
0.08%
1
0.08%
84
6.66%
1,262
Bon Homme
1,826
53.44%
1,574
46.06%
6
0.18%
9
0.26%
2
0.06%
252
7.38%
3,417
Brookings
5,394
52.34%
4,860
47.16%
20
0.19%
29
0.28%
2
0.02%
534
5.18%
10,305
Brown
8,537
49.34%
8,673
50.13%
42
0.24%
39
0.23%
11
0.06%
-136
-0.79%
17,302
Brule
971
49.19%
991
50.20%
9
0.46%
2
0.10%
1
0.05%
-20
-1.01%
1,974
Buffalo
151
30.82%
334
68.16%
2
0.41%
1
0.20%
2
0.41%
-183
-37.34%
490
Butte
2,291
63.96%
1,256
35.06%
19
0.53%
15
0.42%
1
0.03%
1,035
28.90%
3,582
Campbell
909
72.60%
334
26.68%
8
0.64%
1
0.08%
0
0.00%
575
45.92%
1,252
Charles Mix
1,966
46.99%
2,205
52.70%
5
0.12%
4
0.10%
4
0.10%
-239
-5.71%
4,184
Clark
1,247
51.44%
1,164
48.02%
3
0.12%
9
0.37%
1
0.04%
83
3.42%
2,424
Clay
2,307
44.37%
2,859
54.98%
18
0.35%
7
0.13%
9
0.17%
-552
-10.61%
5,200
Codington
5,050
51.99%
4,570
47.05%
34
0.35%
46
0.47%
14
0.14%
480
4.94%
9,714
Corson
710
49.03%
722
49.86%
11
0.76%
4
0.28%
1
0.07%
-12
-0.83%
1,448
Custer
1,806
59.49%
1,180
38.87%
34
1.12%
9
0.30%
7
0.23%
626
20.62%
3,036
Davison
4,024
51.68%
3,705
47.59%
20
0.26%
30
0.39%
7
0.09%
319
4.09%
7,786
Day
1,616
42.82%
2,137
56.62%
19
0.50%
2
0.05%
0
0.00%
-521
-13.80%
3,774
Deuel
1,251
49.49%
1,246
49.29%
17
0.67%
12
0.47%
2
0.08%
5
0.20%
2,528
Dewey
765
42.76%
1,007
56.29%
14
0.78%
1
0.06%
2
0.11%
-242
-13.53%
1,789
Douglas
1,438
67.23%
695
32.49%
3
0.14%
3
0.14%
0
0.00%
743
34.74%
2,139
Edmunds
1,327
51.06%
1,259
48.44%
7
0.27%
4
0.15%
2
0.08%
68
2.62%
2,599
Fall River
2,002
58.59%
1,380
40.39%
25
0.73%
7
0.20%
3
0.09%
622
18.20%
3,417
Faulk
842
53.94%
714
45.74%
2
0.13%
3
0.19%
0
0.00%
128
8.20%
1,561
Grant
2,148
51.49%
1,988
47.65%
19
0.46%
15
0.36%
2
0.05%
160
3.84%
4,172
Gregory
1,566
57.53%
1,138
41.81%
7
0.26%
9
0.33%
2
0.07%
428
15.72%
2,722
Haakon
958
70.91%
379
28.05%
9
0.67%
5
0.37%
0
0.00%
579
42.86%
1,351
Hamlin
1,380
52.06%
1,258
47.45%
9
0.34%
4
0.15%
0
0.00%
122
4.61%
2,651
Hand
1,461
56.67%
1,101
42.71%
8
0.31%
8
0.31%
0
0.00%
360
13.96%
2,578
Hanson
786
50.00%
776
49.36%
8
0.51%
2
0.13%
0
0.00%
10
0.64%
1,572
Harding
633
70.33%
259
28.78%
5
0.56%
3
0.33%
0
0.00%
374
41.55%
900
Hughes
4,545
61.07%
2,853
38.34%
24
0.32%
15
0.20%
5
0.07%
1,692
22.73%
7,442
Hutchinson
2,700
62.56%
1,594
36.93%
9
0.21%
13
0.30%
0
0.00%
1,106
25.63%
4,316
Hyde
546
53.58%
436
42.79%
29
2.85%
5
0.49%
3
0.29%
110
10.79%
1,019
Jackson
671
58.81%
450
39.44%
14
1.23%
2
0.18%
4
0.35%
221
19.37%
1,141
Jerauld
777
50.65%
751
48.96%
2
0.13%
4
0.26%
0
0.00%
26
1.69%
1,534
Jones
521
66.28%
261
33.21%
3
0.38%
1
0.13%
0
0.00%
260
33.07%
786
Kingsbury
1,592
51.57%
1,472
47.68%
11
0.36%
7
0.23%
5
0.16%
120
3.89%
3,087
Lake
2,439
47.62%
2,663
51.99%
8
0.16%
9
0.18%
3
0.06%
-224
-4.37%
5,122
Lawrence
5,570
59.39%
3,705
39.50%
66
0.70%
32
0.34%
6
0.06%
1,865
19.89%
9,379
Lincoln
3,537
52.35%
3,190
47.21%
15
0.22%
9
0.13%
6
0.09%
347
5.14%
6,757
Lyman
843
56.96%
631
42.64%
3
0.20%
3
0.20%
0
0.00%
212
14.32%
1,480
Marshall
1,142
45.23%
1,372
54.34%
7
0.28%
4
0.16%
0
0.00%
-230
-9.11%
2,525
McCook
1,501
50.00%
1,492
49.70%
1
0.03%
6
0.20%
2
0.07%
9
0.30%
3,002
McPherson
1,358
70.14%
571
29.49%
4
0.21%
2
0.10%
1
0.05%
787
40.65%
1,936
Meade
5,189
61.24%
3,212
37.91%
43
0.51%
27
0.32%
2
0.02%
1,977
23.33%
8,473
Mellette
460
53.99%
385
45.19%
6
0.70%
1
0.12%
0
0.00%
75
8.80%
852
Miner
795
45.30%
955
54.42%
4
0.23%
1
0.06%
0
0.00%
-160
-9.12%
1,755
Minnehaha
26,765
47.71%
29,135
51.94%
82
0.15%
84
0.15%
29
0.05%
-2,370
-4.23%
56,095
Moody
1,161
40.19%
1,715
59.36%
4
0.14%
7
0.24%
2
0.07%
-554
-19.17%
2,889
Pennington
19,510
61.44%
12,068
38.00%
90
0.28%
71
0.22%
18
0.06%
7,442
23.44%
31,757
Perkins
1,326
60.36%
851
38.73%
17
0.77%
3
0.14%
0
0.00%
475
21.63%
2,197
Potter
1,175
62.07%
701
37.03%
10
0.53%
5
0.26%
2
0.11%
474
25.04%
1,893
Roberts
2,012
46.67%
2,267
52.59%
20
0.46%
6
0.14%
6
0.14%
-255
-5.92%
4,311
Sanborn
815
51.10%
770
48.28%
4
0.25%
6
0.38%
0
0.00%
45
2.82%
1,595
Shannon
256
17.31%
1,206
81.54%
7
0.47%
4
0.27%
6
0.41%
-950
-64.23%
1,479
Spink
1,969
48.47%
2,071
50.98%
9
0.22%
8
0.20%
5
0.12%
-102
-2.51%
4,062
Stanley
698
57.26%
511
41.92%
8
0.66%
2
0.16%
0
0.00%
187
15.34%
1,219
Sully
571
56.76%
393
39.07%
41
4.08%
1
0.10%
0
0.00%
178
17.69%
1,006
Todd
535
31.92%
1,117
66.65%
5
0.30%
9
0.54%
10
0.60%
-582
-34.73%
1,676
Tripp
2,113
62.96%
1,219
36.32%
13
0.39%
6
0.18%
5
0.15%
894
26.64%
3,356
Turner
2,436
57.47%
1,780
41.99%
11
0.26%
8
0.19%
4
0.09%
656
15.48%
4,239
Union
1,907
41.91%
2,612
57.41%
11
0.24%
14
0.31%
6
0.13%
-705
-15.50%
4,550
Walworth
1,940
63.40%
1,094
35.75%
15
0.49%
9
0.29%
2
0.07%
846
27.65%
3,060
Yankton
4,186
52.05%
3,777
46.96%
26
0.32%
41
0.51%
13
0.16%
409
5.09%
8,043
Ziebach
362
45.53%
427
53.71%
3
0.38%
2
0.25%
1
0.13%
-65
-8.18%
795
Totals
165,415
52.85%
145,560
46.51%
1,060
0.34%
730
0.23%
226
0.07%
19,855
6.34%
312,991
Counties that flipped from Republican to Democratic
See also
Notes
1896 during Bryan's "Cross of Gold" campaign , 1932 during the Dust Bowl , and 1972 when favorite son George McGovern was the Democratic nominee.
References
South Dakota
"1988 Presidential General Election Results – South Dakota" . Dave Leip's Atlas of U.S. Presidential Elections. Retrieved July 21, 2013.SD US Presidential Election Race, November 08, 1988
Categories :
Text is available under the Creative Commons Attribution-ShareAlike License. Additional terms may apply.
**DISCLAIMER** We are not affiliated with Wikipedia, and Cloudflare.
The information presented on this site is for general informational purposes only and does not constitute medical advice.
You should always have a personal consultation with a healthcare professional before making changes to your diet, medication, or exercise routine.
AI helps with the correspondence in our chat.
We participate in an affiliate program. If you buy something through a link, we may earn a commission 💕
↑
 County Results


