In unemployment insurance (UI) in the United States, the average high-cost multiple (AHCM) is a commonly used actuarial measure of Unemployment Trust Fund adequacy. Technically, AHCM is defined as reserve ratio (i.e., the balance of UI trust fund expressed as % of total wages paid in covered employment) divided by average cost rate of three high-cost years in the state's recent history (typically 20 years or a period covering three recessions, whichever is longer). In this definition, cost rate for any duration of time is defined as benefit cost divided by total wages paid in covered employment for the same duration, usually expressed as a percentage.
Intuitively, the AHCM provides an estimate of the length of time (measured in number of years) current reserve in the trust fund (without taking into account future revenue income) can pay out benefits at historically high payout rate. For example, if a state's AHCM is 1.0 immediately prior to a recession, and if the incoming recession is of the average magnitude of the past three recessions, then the state is expected to be able to pay one year of UI benefits using the money already in its trust fund alone. If the AHCM is 0.5, then the state is expected to be able to pay out six months of benefits when the a similar recession hits.
Example
As of December 31, 2009, a state has a balance of $500 million in its UI trust fund. The total wages of its covered employment is $40 billion. The reserve ratio for this state on this day is $500/$40000 = 1.25%. Historically, the state experienced three highest-cost years in 1991, 2002, and 2009, when the cost rates were 1.50, 1.80, and 3.00, respectively. The average high-cost rate for this state is therefore 2.10. Thus, the average high-cost multiple is 1.25/2.10 = 0.595.
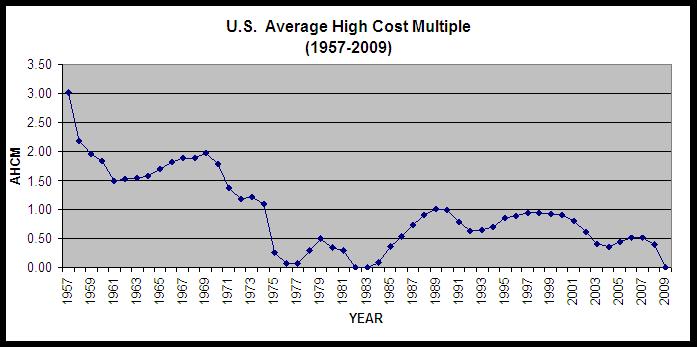
US average high-cost multiple
The following chart shows US average high-cost multiple from 1957 to 2009.
External links
- UI Data Summary
- ET Financial Data Handbook 394
- State UI Trust Fund Calculator
- Ben Casselman: The Unemployment System Isn’t Ready For The Next Recession
This insurance-related article is a stub. You can help Misplaced Pages by expanding it. |
