The climate of south-west England is classed as oceanic (Cfb) according to the Köppen climate classification. The oceanic climate is typified by frequent cloudy skies, cool winters with cool summers and precipitation all year round, with more experienced in winter. Annual rainfall is about 1,000 millimetres (39 in) and up to 2,000 millimetres (79 in) on higher ground. Exceptions include areas to the east of high ground (e.g. Exeter / parts of West Somerset that are subject to a rain shadow effect and annual rainfall is closer to 30 inches).
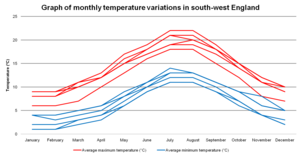
Summer maxima averages range from 18 °C (64 °F) in the Scillies to 22 °C (72 °F) in the east north-east of the region and winter minima averages range from 1 °C (34 °F) in the north-east of the region to 5 °C (41 °F) across the extreme south-west of Cornwall and the Scillies. Cold snaps are generally less intense or prolonged in the south west and rarely does the temperature fall below −15 °C (5 °F). Similarly, prolonged heat is fairly rare, however in recent years there have been more heatwave related conditions, albeit fairly short affairs but in July 2022 temperatures have hit 36 °C (97 °F) in Bude and other parts of the region temperatures were between 33 and 35 °C (91 and 95 °F) widely in more inland locations.
The south west is the second windiest area of the United Kingdom, the majority of winds coming from the south-west and north-West. Government organisations predict the area will experience a rise in temperature and become the hottest region in the United Kingdom.
Inland areas of low altitude experience the least amount of precipitation. They have the highest summer maxima temperatures, but winter minima are lower than those of the coast. Snowfalls are more frequent in comparison to the coast, but less so in comparison to higher ground. They experience the lowest wind speeds and the total sunshine hours are between those of the coast and the moors. This typical climate of inland areas is more noticeable the further north-east into the region.
In comparison to inland areas, the coast experiences high minimum temperatures, especially in winter, and slightly lower maximum temperatures during the summer. Rainfall is lowest at the coast and snowfall there is rarer than the rest of the region. Coastal areas are the windiest parts of the peninsula and they receive the most sunshine. The general coastal climate becomes more prevalent further south-west into the region.
The south-west has areas of moorland inland such as Bodmin Moor, Dartmoor and Exmoor. Because of their high altitude they experience lower temperatures and more precipitation than the rest of the south west (approximately twice as much rainfall as lowland areas). Both of these factors also result in the highest levels of snowfall and the lowest levels of sunshine. Exposed areas of the moors are windier than the lowlands and can be almost as windy as the coast.
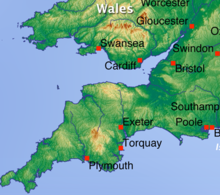
Sunshine is highest on the coast as convective clouds tend to form slightly inland as the ground heats up faster. Annual amounts are around 1700/1800 hours for places like Torquay, Falmouth, Newquay and Ilfracombe, whilst inland areas such as Yeovil, Tiverton and Exeter are cloudier, prone to fog and consequently 1450/1600 hours are more typical.
Definition
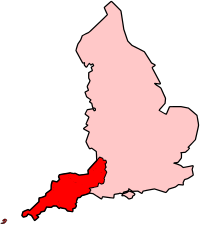
Information in this article relates to the Met Office definition of south-west England, which covers Cornwall, Devon, Somerset, North Somerset, Bath and North East Somerset, South Gloucestershire, the City of Bristol and the Isles of Scilly. This is a smaller area than the UK Government's South West England region, which also covers Gloucestershire, Wiltshire and Dorset. The region is also sometimes loosely described as the West Country.
Temperature
The south-west experiences a seasonal temperature variation, although it is less extreme than most of the United Kingdom. This is because the sea is in closer proximity to inland areas of the south-west than inland areas of most of the United Kingdom and the sea has less seasonal temperature variance. The sea is coldest between February and March; as a result Cornwall and Devon are coldest in February with daily minima ranging from 1.5 °C (34.7 °F) in inland Devon to 5 °C (41 °F) on the Isles of Scilly. The sea has less influence towards the north-east of the region, causing January to be the coldest month with mean minimum temperatures from 1 °C (34 °F) or 2 °C (36 °F). In the months of July and August (the hottest part of the year) daily maxima range from about 19 °C (66 °F) on the coast of Cornwall to 22 °C (72 °F) across inland areas of the north-east (Somerset and North Somerset) and also Exeter due to being situated in the Eastern Lee of Dartmoor.

The sea surrounding the south-west peninsula has the highest annual mean temperature of any sea in the United Kingdom, with a temperature close to 12 to 13 °C (54 to 55 °F). Coastal areas of Cornwall and the Isles of Scilly experience annual mean temperatures similar to that of the sea as the prevailing wind is from the sea. Towards the north-east of the region, the annual mean temperature decreases and is closer to just over 10 °C (50 °F). The sea's influence on annual temperature range is highest in west Cornwall, where the range is approximately 9 °C (48 °F). In the north-east of the region, the range is approximately 12 °C (54 °F). Inland areas are affected by their altitude: the mean temperature decreases as altitude increases. Princetown on Dartmoor, with an altitude of 414 metres (1,358 ft), has a mean temperature of 8 °C (46 °F).
The sea's influence in the south-west usually prevents cold temperatures, however temperatures can plummet during periods of cold easterly air flow: all of which have been recorded in January. In 1987 the minimum temperature recorded at St Mawgan, Cornwall was −9 °C (16 °F) and −7.2 °C (19.0 °F) was noted on the Isles of Scilly. Inland areas have experienced even colder conditions with −15 °C (5 °F) at Exeter International Airport, Devon in 1958 and at Bastreet, Cornwall in 1979. Further to the north-east of the region, temperatures reached −16.1 °C (3.0 °F) in Yeovilton, Somerset in 1982.
Extremely high temperatures (heat waves) are rare in the south-west. Their occurrence is caused by a dry south-easterly air flow off Mainland Europe or the short-lived 'Spanish plume', (caused when low pressure sat to the south west of the UK and High pressure over the Low countries /southern North Sea creates a southerly airflow that sucks up hot air originating from Iberia, and as it crosses Bay of Biscay it picks up moisture and raises humidity levels to uncomfortable levels).
Combined with strong summer sunshine, the temperature rockets: The hottest recorded temperature in the south west is 36 °C (97 °F), on 17 July 2022 at Bude Cornwall. Overnight lows can be uncomfortable, not dropping below 19–20 °C (66–68 °F), 20 °C being classified as a ‘tropical night’.
Sunshine

Average annual sunshine totals rise above 1,600 hours along the coast—higher totals are recorded on the region's southern coast at the English Channel than on its northern coast along the Bristol Channel. 1,400–1,600 hours of annual sunshine are to be expected in inland areas of the south west. In June 1925, the highest monthly sunshine totals were recorded: 381.7 hours at Pendennis Point, Cornwall and 334.8 hours at Long Ashton, Somerset. During the winter months, which are the dullest, less than 20 hours of monthly sunshine have occasionally been recorded. In December 1998 there were 20 days without sun recorded at Yeovilton.
In general, June is the sunniest month, because the days are at their longest, and December is the dullest. The Azores High affects the south-west of England as it extends north-eastwards towards the British Isles. The Azores is more influential in summer. The high pressure reduces cloud cover through the process of subsidence. In spring and summer, the sea is cool compared to the air temperature, causing less convective cloud cover. The convective cloud forms more frequently inland, especially on higher ground such as Dartmoor, Exmoor and Bodmin Moor, thus reducing the amount of sunshine. Coastal areas of the south-west have more hours of sunshine.
Rainfall
Most of the rainfall in the south-west is caused by Atlantic depressions or by convection. Most of the rainfall in autumn and winter is caused by the Atlantic depressions, which is when they are most active. In summer, a large proportion of the rainfall is caused by sun heating the ground leading to convection and to showers and thunderstorms.


The Isles of Scilly have annual rainfall totals of about 850–900 mm (33–35 in). Coastal areas of Cornwall and Devon typically receive 900–1,000 mm (35–39 in) of rainfall annually. The altitude increases the amount of rainfall. Highland areas are cooler, causing moist air to cool below the dew point as it rises over high ground forming clouds and then rain. Princetown is 23 kilometres (14 mi) from Plymouth and 403 metres (1,322 ft) higher, and has double the rainfall. Areas that fall in the rain shadows (lees) of higher ground have lower levels of rainfall: 800 mm (31 in) near Exeter (east of Dartmoor) and 700 mm (28 in) in parts of central Somerset (east of Exmoor). The Mendip Hills, to the north-east of the region, receive over 1,100 mm (43 in) per year and the Bath–Bristol area receives around 800–900 mm (31–35 in).
The sea reaches its highest temperature in late summer/autumn and its lowest in late winter/spring. As a result, the highest rainfall can be expected in autumn and lowest in spring. The months with the most rainfall are in autumn and winter. Monthly rainfall can be variable. On the coast, most months have recorded less than 20 millimetres (0.79 in) and, some months, less than 10 millimetres (0.39 in) at some point. The wettest station of the region, Princetown, has recorded 7 millimetres (0.28 in) of rain during May.
The number of days with at least 1 millimetre (0.039 in) of rainfall correlates to the pattern of quantity of rainfall. In late spring/summer, 9–10 days per month recorded rain in coastal areas, 7–9 days in the north-east and 12–13 days at high altitude (Princetown). In winter these values increase to 15–16 on the coast, 12–13 in the north-east and over 18 days in high altitude.
Very heavy rainfall, spanning 5–15 hours, is rare in the south-west. Instances include the Lynmouth disaster of 15 August 1952, caused by 228 millimetres (9.0 in) of rainfall falling locally on Exmoor over 12 hours. Also, on 8 June 1957, 203 millimetres (8.0 in) fell at Camelford, Cornwall and in June 1917, 243 millimetres (9.6 in) fell in 13 hours in Bruton, Somerset. The north-Cornish village of Boscastle was flooded on 16 August 2004; a peak hourly rainfall of 80 millimetres (3.1 in) was recorded. Approximately 100 people had to be rescued by helicopter and 116 cars were swept out to sea.
From December 2013 onwards the Somerset Levels suffered severe flooding as part of the wider winter storms of 2013–14 in the United Kingdom. The Levels are a low-lying area around 10 to 12 feet (3 to 4 m) above mean sea level (O.D.) which have been prone to flooding from fresh water and occasional salt water inundations. People have attempted to drain the area for hundreds of years. During December 2013 and January 2014 heavy rainfall led to extensive flooding with over 600 houses and 17,000 acres (6,900 ha) of agricultural land, including North Moor, Curry and Hay Moors and Greylake, affected. The village of Thorney was abandoned and Muchelney cut off.
Snowfall

Snowfall normally occurs between November and April and short snowfalls can occur between October and May on higher ground. The snow usually only settles between the months of December and March. Snow rarely falls when temperatures are greater than 4 °C (39 °F) and for snow to settle temperatures must normally be lower than 4 °C (39 °F).
In the south-west the number of days of snowfall increases with altitude: per approximately every 100 m (330 ft) increase in altitude, the number of days of snow falling increases by five days. From 1979 to 2000, on average there were fewer than 10 days per winter in which snow fell in the islands of the south-west and the coastal areas of Devon and Cornwall, and slightly more than 10 days on average near to the Severn Estuary. Inland areas received between 8–15 days of snow falling; more days of snow fall were noted particularly to the north-east. Some upland areas received, on average, over 25 days per year of snow falling.
Similarly to the ratio of days of snow falling to altitude, the number of days in which snow settles on the ground increases by five days per every 100 m (330 ft) increase in altitude. In the south-west, it is rare that snow settles on the ground. From 1979 to 2000 on average, lowland areas did not record any lying snow in one out of every three years. During this period, snow settled, on average, fewer than three days per year across the Isles of Scilly and on the coasts of Devon and Cornwall. Inland areas had an average of 5–10 days of snow lying per year and, as with the days of snow falling; this was higher towards the north-east of the region. More than 20 days of snow lying can be expected on the high grounds of Dartmoor and Exmoor.
The south-west, although the mildest region of the British Isles, has been affected by some of the most severe blizzards. Blizzards are a rare occurrence in the United Kingdom, but can occur when especially cold easterly winds from the continent meet an Atlantic depression, causing a prolonged snowstorm and high winds. This occurred in February 1978, when 50 cm (20 in) of snow accumulated in inland Devon and 90 cm (35 in) on Dartmoor and Exmoor, caused by −2 °C (28 °F) winds at 25 knots (46 km/h; 29 mph). In January 1982, snow drifts were 1 m (3 ft 3 in) deep around the Bristol area. Convective showers on 12 January 1987 left parts of Cornwall with deep snow: 35 cm (14 in) at Falmouth, 39 cm (15 in) Penzance and 23 cm (9.1 in) on the Isles of Scilly.
Wind
The south-west is the second most exposed area of the United Kingdom; second to western Scotland. The strong winds are caused by deep depressions across or close to the British Isles. Winds are stronger in the winter-half year, as the depressions' strength and frequency increase. The lightest mean wind speeds are in summer. The speed of peak gusts and mean wind speed follow a similar pattern throughout the year.
Mean wind speeds are generally lower to the north-east of the region and in inland areas. Yeovilton, lowland Somerset, has a mean wind speed that is two thirds that of St. Mawgan in coastal Cornwall. An increase in altitude in inland areas generally increases the mean wind speed; similar wind speeds are recorded on the highest parts of Exmoor and Dartmoor as on the coast.

The majority, and the strongest, of the winds are from the south-west and north-east as Atlantic depressions pass from west to east over the United Kingdom. When an Atlantic depression reaches the United Kingdom, winds usually blow from the south or south-west, and they change to west or north-west when the depression leaves. If a depression passes along the English Channel, strong winds can occur from the east or north-east. Due to anticyclogenesis over Scandinavia, the majority of winds in Spring are from the north-east. Coastal areas of the south-west usually experience calm or very light winds that do not have a classifiable wind direction less than 6% of the time; this figure is 15% in the north-east and inland areas.
Islands and exposed headlands have the highest number of days per year of gale-force winds (averaged out over ten consecutive minutes). A gale-force wind is defined as being at least 34 knots (63 km/h; 39 mph), which is 8 on the modern Beaufort scale. Gales are recorded approximately 24 days per year in the Isles of Scilly and coastal Cornwall. Further north-east and further inland, the number of days decreases. Plymouth, coastal Devon, receives 16 days; Yeovilton, Somerset, receives seven; and Long Ashton, north-west Somerset, receives four. Wind speeds can vary on local topography: wooded or urban areas sheltered by hills receive fewer days of gales and lower wind speeds.
On 15 December 1979, there were gusts of 91 knots (169 km/h; 105 mph) at Lizard Point, Cornwall 99 knots (183 km/h; 114 mph) at St Mary's, Isles of Scilly and 103 knots (191 km/h; 119 mph) at Gwennap Head, Cornwall. Widespread winds from the Burns' Day storm on 25 January 1990 overturned vehicles and damaged buildings. It caused the highest wind speed during the 1971–2001 period to be recorded in two stations: 84 knots (156 km/h; 97 mph) at Plymouth and 85 knots (157 km/h; 98 mph) at St Mawgan. 79 knots (146 km/h; 91 mph) was recorded on top of a building in Bristol as well as 74 knots (137 km/h; 85 mph) at Exeter International Airport and 68 knots (126 km/h; 78 mph) at Yeovilton. At Plymouth, the maximum hourly mean speed was 60 knots (110 km/h; 69 mph) and at Yeovilton, 45 knots (83 km/h; 52 mph). The Bristol Channel floods on 30 January 1607 apparently caused "many thousand" deaths and may have destroyed several small harbours. The cause of it is disputed to be either a European windstorm or a tsunami.
Future

According to a study by the Met Office, within 40 years the average temperature is likely to increase by 2 °C (3.6 °F) in the south-west and the average warmest summer day will increase by 3 °C (5.4 °F) to be 31 °C (88 °F). It predicts that the region will have one of the highest annual temperatures in the United Kingdom and there will be an estimated 53 millimetres (2.1 in) increase in winter precipitation.
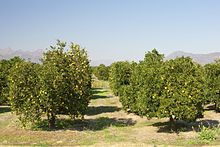
The rise in temperature could lead to outdoor citrus cultivation being possible. Sea level rises could cause spring tides to rise over many of the region's harbour walls and an increase in sea level by about 40 centimetres (16 in) at Newlyn. Following the announcement, the government of the United Kingdom called on the local authorities and other organisation to prepare for the consequences. All major government investments will have to consider the risks as a result of future climate change.
A report from the Environment Agency said that, over the next 25 years, investment would need to double for the building and upkeep of flood defences in order to maintain the current levels of flood protection and counter the effects of climate change. Flooding from rivers and the sea currently puts 65,369 properties at risk in Devon and Cornwall, 29,577 of which are at "significant risk". Current flood defence schemes protect some of these properties from flooding. Richard Cresswell, the regional director for the Environment Agency in the south west, said:
"The latest UK climate change data shows that the risk of flooding and coastal erosion will continue to increase in future due to rising sea levels and more frequent and heavy storms."
£357 million on flood risk management in Cornwall, Devon, Dorset, Somerset, South Gloucestershire and Wiltshire has been spent since 2002, which includes spending continuing into 2009/10.
Rising sea levels are likely to cause more flooding on the Somerset Levels. Since 1990 the drainage board has been charged with looking at the rhynes, cleaning them out and keeping them clear, with the Environment Agency overseeing the work. With rising sea levels the work required to maintain the current sea defences is likely to become more expensive and it has been proposed by Ian Liddell-Grainger (formerly the MP for Bridgwater), that two inland seas are created.
Climate charts
| Bude | ||||||||||||||||||||||||||||||||||||||||||||||||||||||||||||
|---|---|---|---|---|---|---|---|---|---|---|---|---|---|---|---|---|---|---|---|---|---|---|---|---|---|---|---|---|---|---|---|---|---|---|---|---|---|---|---|---|---|---|---|---|---|---|---|---|---|---|---|---|---|---|---|---|---|---|---|---|
| Climate chart (explanation) | ||||||||||||||||||||||||||||||||||||||||||||||||||||||||||||
| ||||||||||||||||||||||||||||||||||||||||||||||||||||||||||||
| ||||||||||||||||||||||||||||||||||||||||||||||||||||||||||||
| Nettlecombe | ||||||||||||||||||||||||||||||||||||||||||||||||||||||||||||
|---|---|---|---|---|---|---|---|---|---|---|---|---|---|---|---|---|---|---|---|---|---|---|---|---|---|---|---|---|---|---|---|---|---|---|---|---|---|---|---|---|---|---|---|---|---|---|---|---|---|---|---|---|---|---|---|---|---|---|---|---|
| Climate chart (explanation) | ||||||||||||||||||||||||||||||||||||||||||||||||||||||||||||
| ||||||||||||||||||||||||||||||||||||||||||||||||||||||||||||
| ||||||||||||||||||||||||||||||||||||||||||||||||||||||||||||
| Princetown | ||||||||||||||||||||||||||||||||||||||||||||||||||||||||||||
|---|---|---|---|---|---|---|---|---|---|---|---|---|---|---|---|---|---|---|---|---|---|---|---|---|---|---|---|---|---|---|---|---|---|---|---|---|---|---|---|---|---|---|---|---|---|---|---|---|---|---|---|---|---|---|---|---|---|---|---|---|
| Climate chart (explanation) | ||||||||||||||||||||||||||||||||||||||||||||||||||||||||||||
| ||||||||||||||||||||||||||||||||||||||||||||||||||||||||||||
| ||||||||||||||||||||||||||||||||||||||||||||||||||||||||||||
| St. Mawgan | ||||||||||||||||||||||||||||||||||||||||||||||||||||||||||||
|---|---|---|---|---|---|---|---|---|---|---|---|---|---|---|---|---|---|---|---|---|---|---|---|---|---|---|---|---|---|---|---|---|---|---|---|---|---|---|---|---|---|---|---|---|---|---|---|---|---|---|---|---|---|---|---|---|---|---|---|---|
| Climate chart (explanation) | ||||||||||||||||||||||||||||||||||||||||||||||||||||||||||||
| ||||||||||||||||||||||||||||||||||||||||||||||||||||||||||||
| ||||||||||||||||||||||||||||||||||||||||||||||||||||||||||||
| Teignmouth | ||||||||||||||||||||||||||||||||||||||||||||||||||||||||||||
|---|---|---|---|---|---|---|---|---|---|---|---|---|---|---|---|---|---|---|---|---|---|---|---|---|---|---|---|---|---|---|---|---|---|---|---|---|---|---|---|---|---|---|---|---|---|---|---|---|---|---|---|---|---|---|---|---|---|---|---|---|
| Climate chart (explanation) | ||||||||||||||||||||||||||||||||||||||||||||||||||||||||||||
| ||||||||||||||||||||||||||||||||||||||||||||||||||||||||||||
| ||||||||||||||||||||||||||||||||||||||||||||||||||||||||||||
| Yeovilton | ||||||||||||||||||||||||||||||||||||||||||||||||||||||||||||
|---|---|---|---|---|---|---|---|---|---|---|---|---|---|---|---|---|---|---|---|---|---|---|---|---|---|---|---|---|---|---|---|---|---|---|---|---|---|---|---|---|---|---|---|---|---|---|---|---|---|---|---|---|---|---|---|---|---|---|---|---|
| Climate chart (explanation) | ||||||||||||||||||||||||||||||||||||||||||||||||||||||||||||
| ||||||||||||||||||||||||||||||||||||||||||||||||||||||||||||
| ||||||||||||||||||||||||||||||||||||||||||||||||||||||||||||
See also
References
- "About south-west England". The Met Office. Archived from the original on 13 June 2007. Retrieved 31 July 2009.
- ^ "South-west England: Temperature". The Met Office. Archived from the original on 24 February 2007. Retrieved 16 April 2009.
- ^ "South-west England: Sunshine". The Met Office. Archived from the original on 24 May 2007. Retrieved 16 April 2009.
- ^ "South-west England: Rainfall". The Met Office. Archived from the original on 20 May 2007. Retrieved 16 April 2009.
- Sene, Kevin (2008). Flood Warning, Forecasting and Emergency Response. Springer. p. 236. ISBN 978-3-540-77852-3. Retrieved 30 July 2009.
- Williams, Michael (1970). The Draining of the Somerset Levels. Cambridge University Press. pp. 8–9. ISBN 0-521-07486-X.
- Williams, Michael (1970). The Draining of the Somerset Levels. Cambridge University Press. p. 50. ISBN 0-521-07486-X.
- Steven Morris (24 January 2014). "UK floods: council declares major incident on Somerset Levels". The Guardian. Retrieved 24 January 2014.
- "Living with the Somerset floods". BBC News. February 2014. Retrieved 11 February 2014.
- "UK prepares for freezing weekend". BBC News Online. 6 February 2009. Retrieved 30 June 2009.
- ^ "South-west England: Snowfall". The Met Office. Archived from the original on 2 April 2007. Retrieved 16 April 2009.
- ^ "South-west England: Wind". The Met Office. Archived from the original on 15 May 2007. Retrieved 17 April 2009.
- Bryant, Edward; Simon Haslett (2002). "Was the AD 1607 Coastal Flooding Event in the Severn Estuary and Bristol Channel (UK) Due to a Tsunami?". Archaeology in the Severn Estuary: 166. ISSN 1354-7089. Retrieved 31 July 2009.
- "Climate change map". The Met Office. Retrieved 17 November 2009.
- ^ "South west faces temperature jump". BBC News Online. 19 June 2009. Retrieved 25 June 2009.
- "Somerset Levels". House of Commons Debates – Hansard. Archived from the original on 30 September 2007. Retrieved 10 June 2007.
- "Bude 1971–2000 averages". The Met Office. Retrieved 20 July 2009.
- "Nettlecombe 1971–2000 averages". The Met Office. Archived from the original on 2 March 2014. Retrieved 13 March 2009.
- "Princetown 1971–2000 averages". The Met Office. Retrieved 10 April 2008.
- "St. Mawgan 1971–2000 averages". The Met Office. Retrieved 20 July 2009.
- "Teignmouth 1971–2000 averages". The Met Office. Retrieved 8 March 2008.
- "Yeovilton 1971–2000 averages". The Met Office. Retrieved 20 July 2009.
External links
| Climate of Europe | |
|---|---|
| Sovereign states |
|
| States with limited recognition | |
| Dependencies and other entities | |
| Other entities | |
| England articles | |||||||||||||||||
|---|---|---|---|---|---|---|---|---|---|---|---|---|---|---|---|---|---|
| History |
| ||||||||||||||||
| Geography | |||||||||||||||||
| Politics | |||||||||||||||||
| Culture |
| ||||||||||||||||
Categories: