The Maas–Hoffman model is a mathematical tool to characterize the relation between crop production and soil salinity. It describes the crop response by a broken line of which the first part is horizontal and the second is sloping downward. The breakpoint (Pb) or threshold is also called tolerance because up to that point the yield is unaffected by the salinity, so the salt is tolerated, while at greater salinity values the crops are affected negatively and the yield goes down.
Mathematics
Mathematically the two lines are represented by the equations:
where Y is the crop production or yield, C is the maximum yield, X is the soil salinity, A is the slope (regression coefficient) of the descending line, and B is the regression constant of that line.
In the example of the figure: C = 1.2, A = —0.10, Pb = 7.0
The value of Pb is to be found by regression analysis and optimization so that the goodness of fit of the data to the model is maximum.
The Maas–Hoffman model is used in crop tolerance to seawater.

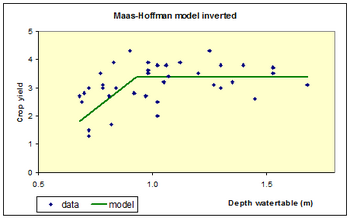
Inverted model
For growth factors, like the depth of the watertable, that affect crop production negatively at low values while there is no effect at high values, the inverted Maas–Hoffman model can be used.
See also
References
- Maas EV, Hoffman GJ, 1977. Crop salt tolerance-current assessment. Journal of the Irrigation and Drainage Division, American Society of Civil Engineers 103: 115-134.
