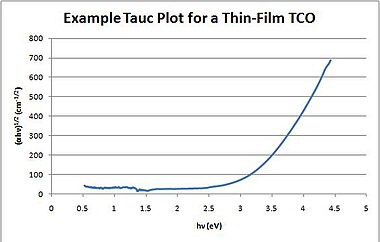
A Tauc plot is used to determine the optical bandgap, or Tauc bandgap, of either disordered or amorphous semiconductors.
In his original work Jan Tauc (/taʊts/) showed that the optical absorption spectrum of amorphous germanium resembles the spectrum of the indirect transitions in crystalline germanium (plus a tail due to localized states at lower energies), and proposed an extrapolation to find the optical bandgap of these crystalline-like states. Typically, a Tauc plot shows the quantity hν (the photon energy) on the abscissa (x-coordinate) and the quantity (αhν) on the ordinate (y-coordinate), where α is the absorption coefficient of the material. Thus, extrapolating this linear region to the abscissa yields the energy of the optical bandgap of the amorphous material.
A similar procedure is adopted to determine the optical bandgap of crystalline semiconductors. In this case, however, the ordinate is given by (α), in which the exponent denotes the nature of the transition:
- r = 1/2 for direct allowed transitions
- r = 3/2 for direct forbidden transitions.
- r = 2 for indirect allowed transitions
- r = 3 for indirect forbidden transitions
Again, the resulting plot (quite often, incorrectly identified as a Tauc plot) has a distinct linear region that, extrapolated to the abscissa, yields the energy of the optical bandgap of the material.
See also
References
- Tauc, J. (1968). "Optical properties and electronic structure of amorphous Ge and Si". Materials Research Bulletin. 3: 37–46. doi:10.1016/0025-5408(68)90023-8.
-
Mott, N. F. & Davis, E. A. (1979). Electronic processes in non-crystalline materials. Clarendon Press, Oxford. ISBN 0-19-851288-0.
{{cite book}}: CS1 maint: multiple names: authors list (link) - Street, R. A. (1991). Hydrogenated amorphous silicon. Cambridge Univ. Press, Cambridge. ISBN 0-521-37156-2.
- Tauc, J.; Grigorovici, R.; Vancu, A. (1966). "Optical Properties and Electronic Structure of Amorphous Germanium". Physica Status Solidi B. 15 (2): 627. Bibcode:1966PSSBR..15..627T. doi:10.1002/pssb.19660150224. S2CID 121844404.
-
Yu, P. Y. & Cardona, M. (1996). Fundamentals of semiconductors. Springer, Berlin. ISBN 3-540-61461-3.
{{cite book}}: CS1 maint: multiple names: authors list (link) - MacFarlane, G. G. & Roberts, V. (1955). "Infrared absorption of germanium near the lattice edge". Physical Review. 97 (6): 1714–1716. Bibcode:1955PhRv...97.1714M. doi:10.1103/PhysRev.97.1714.2.
{{cite journal}}: CS1 maint: multiple names: authors list (link) - MacFarlane, G. G., McLean, T. P., Quarrington, J. E. & Roberts, V. (1958). "Fine structure in the absorption-edge spectrum of Si". Physical Review. 111 (5): 1245–1254. Bibcode:1958PhRv..111.1245M. doi:10.1103/PhysRev.111.1245.
{{cite journal}}: CS1 maint: multiple names: authors list (link) - Davis, E. A.; Mott, N. F. (1970). "Conduction in non-crystalline systems V. Conductivity, optical absorption and photoconductivity in amorphous semiconductors". Philosophical Magazine A. 22 (179): 903–922. Bibcode:1970PMag...22..903D. doi:10.1080/14786437008221061.
- Zanatta, A. R. (2019). "Revisiting the optical bandgap of semiconductors and the proposal of a unified methodology to its determination". Scientific Reports. 9 (1): 11225–12pp. Bibcode:2019NatSR...911225Z. doi:10.1038/s41598-019-47670-y. PMC 6677798. PMID 31375719.