| Maryland's 5th congressional district | |
|---|---|
 Interactive map of district boundaries since January 3, 2023 Interactive map of district boundaries since January 3, 2023 | |
| Representative | Steny Hoyer D–Mechanicsville |
| Area | 1,504.25 sq mi (3,896.0 km) |
| Distribution |
|
| Population (2023) | 812,172 |
| Median household income | $122,220 |
| Ethnicity |
|
| Occupation |
|
| Cook PVI | D+15 |
Maryland's 5th congressional district comprises all of Charles, St. Mary's, and Calvert counties (a region known as Southern Maryland), as well as portions of Prince George's and Anne Arundel counties. The district is currently represented by Democrat Steny Hoyer, who from 2007 to 2011 and from 2019 to 2023 was House Majority Leader.
When it was defined in 1788, the 5th Congressional District centered on Salisbury, Maryland. It consisted of the current Maryland counties of Caroline, Dorchester, Wicomico, Somerset, and Worcester. In 1792 the boundaries of Maryland's congressional districts were redrawn, and the 5th District was made to include Baltimore and Baltimore County.
This district is safely Democratic, and has been in Democratic hands uninterrupted since the retirement of Lawrence Hogan (father of future Governor of Maryland Larry Hogan) in 1975. He was succeeded by Gladys Spellman, who served from 1975 until the seat was declared vacant by the House due to her falling into a coma in 1980. Hoyer won a special election that year to complete her term, and has held the seat since.
Recent election results from statewide races
| Year | Office | Results |
|---|---|---|
| 2008 | President | Obama 62% – 36% |
| 2012 | President | Obama 64% – 36% |
| 2016 | President | Clinton 59% – 35% |
| Senate | Van Hollen 60% – 36% | |
| 2018 | Senate | Cardin 66% – 30% |
| Governor | Hogan 54% – 45% | |
| Attorney General | Frosh 66% – 34% | |
| 2020 | President | Biden 67% – 31% |
| 2022 | Senate | Van Hollen 67% – 33% |
| Governor | Moore 66% – 31% | |
| Attorney General | Brown 67% – 33% | |
| Comptroller | Lierman 65% – 35% | |
| 2024 | President | Harris 65% – 32% |
| Senate | Alsobrooks 58% – 39% |
Composition
| # | County | Seat | Population |
|---|---|---|---|
| 1 | Anne Arundel | Annapolis | 594,582 |
| 9 | Calvert | Prince Frederick | 94,728 |
| 17 | Charles | La Plata | 171,973 |
| 33 | Prince George's | Upper Marlboro | 947,430 |
| 37 | St. Mary's | Leonardtown | 115,281 |
Cities of 10,000 or more people
- Waldorf – 81,410
- Bowie – 58,329
- Odenton – 42,947
- Clinton – 38,760
- Crofton – 29,641
- Camp Springs – 22,734
- Maryland City – 19,153
- Bennsville – 15,288
- Glenn Dale – 14,698
- Lake Arbor – 14,541
- Kettering – 14,424
- Accokeek – 13,927
- Lexington Park – 13,318
- Brock Hall – 13,181
- California – 12,947
- Forestville – 12,831
- Westphalia – 11,770
- Largo – 11,605
- Rosaryville – 11,5548
- Mitchellville – 11,136
- Brandywine – 10,550
- Jessup – 10,535
- Chesapeake Ranch Estates – 10,308
- La Plata – 10,159
2,500 – 10,000 people
- Marlton – 9,802
- Edgewater – 9,446
- Fort Meade – 9,324
- Marlboro Village – 9,221
- Mayo – 8,832
- Bryans Road – 8,650
- Fairwood – 7,983
- Wildewood – 7,821
- Chesapeake Beach – 6,356
- Shady Side – 5,806
- Deale – 4,943
- Leonardtown – 4,563
- Woodmore – 4,513
- Riva – 4,257
- Melwood – 3,977
- Indian Head – 3,894
- Marlboro Meadows – 3,655
- Golden Beach – 3,651
- Huntingtown – 3,545
- Brown Station – 3,298
- Prince Frederick – 3,226
- Croom – 2,720
Recent elections
2000s
| Party | Candidate | Votes | % | |
|---|---|---|---|---|
| Democratic | Steny Hoyer (inc.) | 166,231 | 65.09 | |
| Republican | Thomas E. Hutchins | 89,109 | 34.89 | |
| Write-in | 125 | 0.05 | ||
| Total votes | 255,375 | 100.00 | ||
| Democratic hold | ||||
| Party | Candidate | Votes | % | |
|---|---|---|---|---|
| Democratic | Steny Hoyer (inc.) | 137,903 | 69.36 | |
| Republican | Joseph T. Crawford | 60,758 | 30.56 | |
| Green | Bob S. Auerbach (write-in) | 158 | 0.08 | |
| Total votes | 198,819 | 100.00 | ||
| Democratic hold | ||||
| Party | Candidate | Votes | % | ±% | |
|---|---|---|---|---|---|
| Democratic | Steny Hoyer (inc.) | 204,867 | 68.72% | −0.64 | |
| Republican | Brad Jewitt | 87,189 | 29.25% | −1.31 | |
| Green | Bob S. Auerbach | 4,224 | 1.42% | +1.34 | |
| Constitution | Steve Krukar | 1,849 | 0.62% | +0.62 | |
| Total votes | 298,129 | 100.00 | |||
| Democratic hold | |||||
| Party | Candidate | Votes | % | ±% | |
|---|---|---|---|---|---|
| Democratic | Steny Hoyer (inc.) | 168,114 | 82.68% | +13.96 | |
| Green | Steve Warner | 33,464 | 16.46% | +15.04 | |
| Constitution | Peter Kuhnert | 635 | 0.31% | −0.31 | |
| Write-in | 1,110 | 0.55% | +0.55 | ||
| Total votes | 203,323 | 100.00 | |||
| Democratic hold | |||||
| Party | Candidate | Votes | % | ±% | |
|---|---|---|---|---|---|
| Democratic | Steny Hoyer (inc.) | 253,854 | 73.65% | −9.03 | |
| Republican | Collins Bailey | 82,631 | 23.97% | +23.97 | |
| Libertarian | Darlene H. Nicolas | 7,829 | 2.27% | +2.27 | |
| Write-in | 377 | 0.11 | -0.44 | ||
| Total votes | 344,691 | 100.00 | |||
| Democratic hold | Swing | ||||
2010s
| Party | Candidate | Votes | % | ±% | |
|---|---|---|---|---|---|
| Democratic | Steny Hoyer (inc.) | 155,110 | 64.26% | −9.39 | |
| Republican | Charles Lollar | 83,575 | 34.62% | +10.65 | |
| Libertarian | H Gavin Shickle | 2,578 | 1.07% | −1.20 | |
| Write-in | 120 | 0.05% | -0.06 | ||
| Total votes | 241,383 | 100.00 | |||
| Democratic hold | |||||
| Party | Candidate | Votes | % | |
|---|---|---|---|---|
| Democratic | Steny H. Hoyer (inc.) | 238,618 | 69.4 | |
| Republican | Tony O'Donnell | 95,271 | 27.7 | |
| Green | Bob Auerbach | 5,040 | 1.5 | |
| Libertarian | Arvin Vohra | 4,503 | 1.3 | |
| Write-in | 388 | 0.1 | ||
| Total votes | 343,820 | 100 | ||
| Democratic hold | ||||
| Party | Candidate | Votes | % | |
|---|---|---|---|---|
| Democratic | Steny H. Hoyer (inc.) | 144,725 | 64 | |
| Republican | Chris Chaffee | 80,752 | 35.7 | |
| N/A | Others | 563 | .3 | |
| Total votes | 226,040 | 100 | ||
| Democratic hold | ||||
| Party | Candidate | Votes | % | |
|---|---|---|---|---|
| Democratic | Steny H. Hoyer (inc.) | 242,989 | 67.4 | |
| Republican | Mark Arness | 105,931 | 29.4 | |
| Libertarian | Jason Summers | 11,078 | 3.1 | |
| Write-in | 636 | 0.2 | ||
| Total votes | 360,634 | 100 | ||
| Democratic hold | ||||
| Party | Candidate | Votes | % | |
|---|---|---|---|---|
| Democratic | Steny Hoyer (incumbent) | 213,796 | 70.3 | |
| Republican | William Devine III | 82,361 | 27.1 | |
| Green | Patrick Elder | 4,082 | 1.3 | |
| Libertarian | Jacob Pulcher | 3,592 | 1.2 | |
| Write-in | 279 | 0.1 | ||
| Republican | Johnny Rice (write-in) | 99 | 0.0 | |
| Total votes | 304,479 | 100 | ||
| Democratic hold | ||||
2020s
| Party | Candidate | Votes | % | |
|---|---|---|---|---|
| Democratic | Steny Hoyer (incumbent) | 274,210 | 68.8 | |
| Republican | Chris Palombi | 123,525 | 31.0 | |
| Write-in | 1,104 | 0.3 | ||
| Total votes | 398,839 | 100 | ||
| Democratic hold | ||||
| Party | Candidate | Votes | % | |
|---|---|---|---|---|
| Democratic | Steny Hoyer (incumbent) | 182,478 | 65.9 | |
| Republican | Chris Palombi | 94,000 | 33.9 | |
| Write-in | 442 | 0.2 | ||
| Total votes | 276,920 | 100 | ||
| Democratic hold | ||||
List of members representing the district
1789–1803: one seat
| Name | Years | Cong ress |
Party | Electoral history |
|---|---|---|---|---|
| District created March 4, 1789 | ||||
 George Gale (Somerset County) |
March 4, 1789 – March 3, 1791 |
1st | Pro-Administration | Elected in 1789. Lost re-election. |
 William Vans Murray (Cambridge) |
March 4, 1791 – March 3, 1793 |
2nd | Pro-Administration | Elected in 1790. Redistricted to the 8th district. |
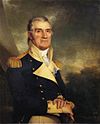 Samuel Smith (Baltimore) |
March 4, 1793 – March 3, 1803 |
3rd 4th 5th 6th 7th |
Democratic-Republican | Elected in 1792. Re-elected in 1794. Re-elected in 1796. Re-elected in 1798. Re-elected in 1801. Retired to run for U.S. Senate. |
1803–1833: two seats
From 1803 to 1833, two seats were apportioned, elected at-large on a general ticket.
1833–present: one seat
See also
Notes
- ^ Supported the Jackson faction in the 1824 United States presidential election
Sources
- "My Congressional District".
- "2022 Cook PVI: District Map and List". The Cook Political Report. July 12, 2022. Retrieved October 8, 2022.
- "Biographies - Gladys Noon Spellman". msa.maryland.gov. Retrieved May 15, 2024.
- "Steny Hoyer, Representative for Maryland's 5th Congressional District". GovTrack.us. Retrieved May 15, 2024.
- https://davesredistricting.org/maps#viewmap::a365ecbd-db5f-4c84-a77f-90310c6a6c1a
- Statewide Data Breakdown by State Congressional Districts. elections.maryland.gov (Report). Archived from the original on August 9, 2024.
- Statewide Data Breakdown by State Congressional Districts. elections.maryland.gov (Report). Archived from the original on December 9, 2024.
- "Unofficial 2012 Presidential General Election results for Representative in Congress". Maryland State Board of Elections. Retrieved November 12, 2012.
- "Official 2020 Presidential General Election results for Representative in Congress". Maryland State Board of Elections. Retrieved December 14, 2020.
- Archives of Maryland Historical List United States Representatives Maryland State Archives
- Martis, Kenneth C. (1989). The Historical Atlas of Political Parties in the United States Congress. New York: Macmillan Publishing Company.
- Martis, Kenneth C. (1982). The Historical Atlas of United States Congressional Districts. New York: Macmillan Publishing Company.
- Congressional Biographical Directory of the United States 1774–present
| Maryland's congressional districts | |
|---|---|
|
38°33′N 76°57′W / 38.55°N 76.95°W / 38.55; -76.95
Categories: